We have moved! Mango Information Systems (Belgium) is now Alef (Spain).
Blog articles in category engineering
Data visualization
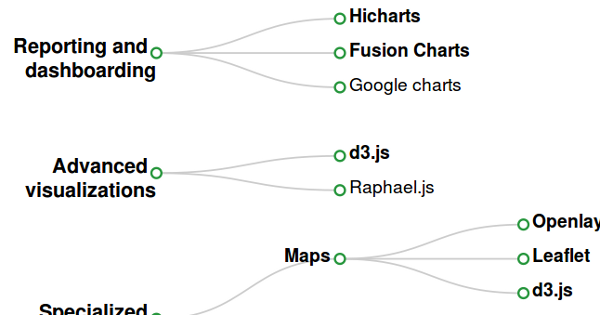
How to choose the right web Data Visualization library
Review of the most relevant charting libraries for common web data visualizations and reporting projects use cases. Should you choose Highcharts or d3?
Pre-render d3.js charts at server side
part1: proof-of-concept
How to pre-render d3.js data visualizations at server side, using jsdom node.js module. This is useful to support large graphics on slow machines.
Side projects
Demonstrate your tech skills with facts
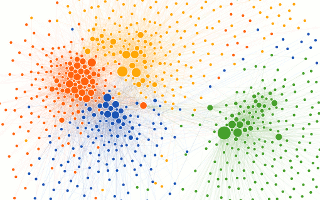
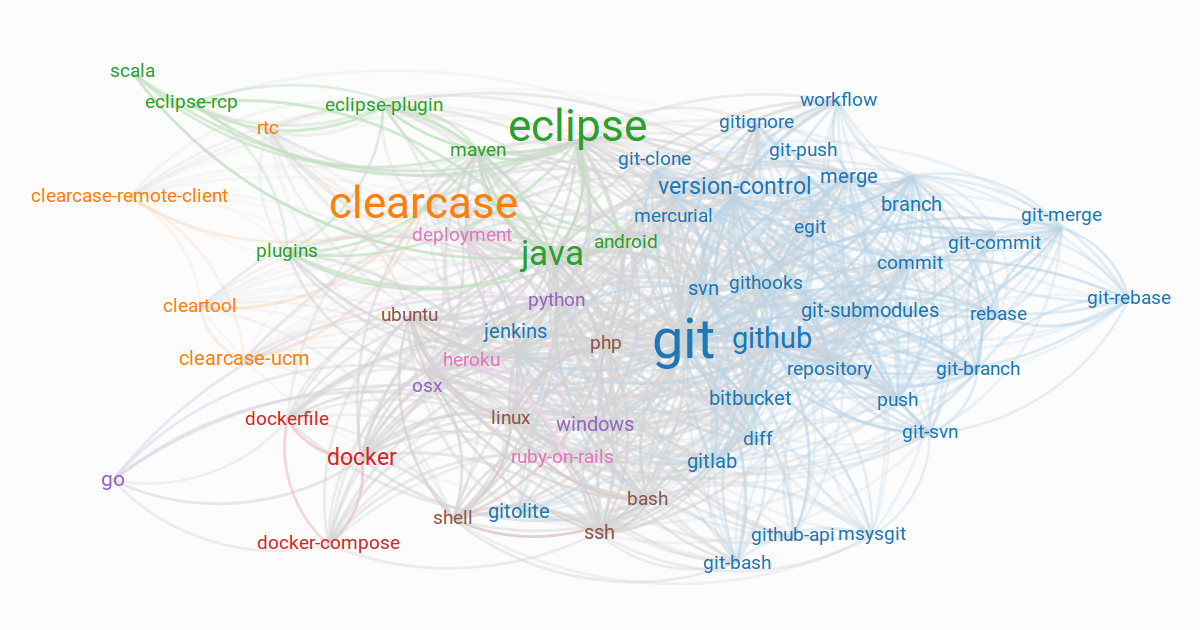
Introducing myTagOverflow
Our newest creation is a free web app that generates a data visualization showing the tags on which you are most active on stackOverflow.
A dashboard to find the best time to upgrade your server
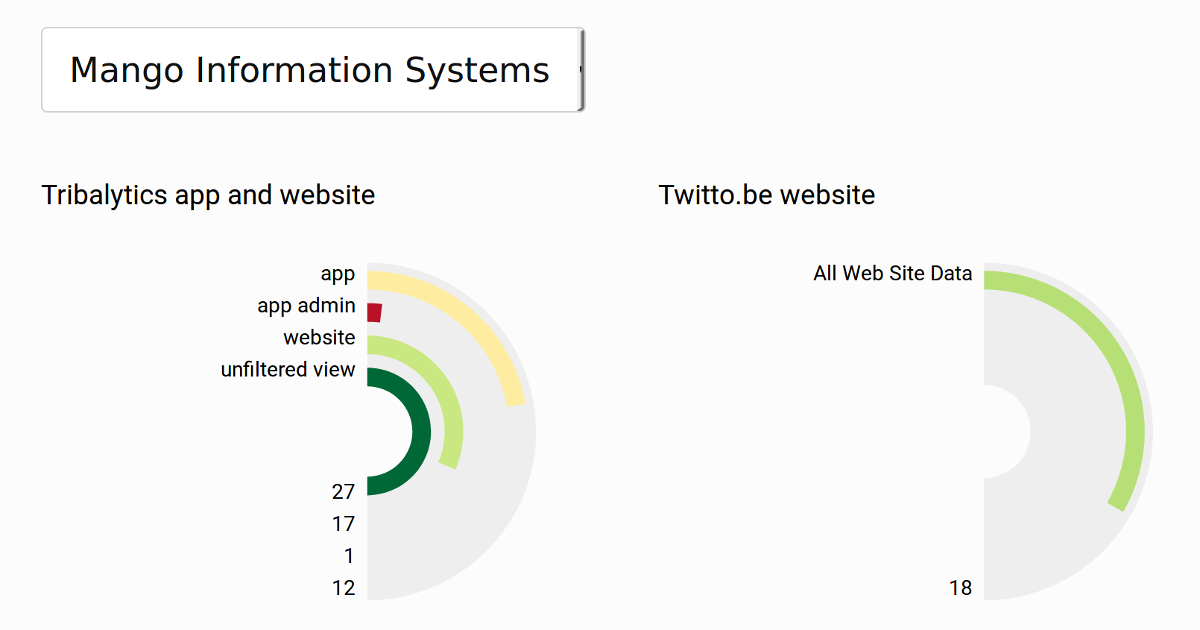
Introducing multiGa live Google Analytics dashboard
The story of why and how we created a free dashboard showing Google Analytics live traffic data on multiple websites.